Why it is so wrong to average ratios: Simpson's paradox
As a statistics major, I haven't fully appreciated the wonder of Simpson's paradox until I run through real problems in practice. Simpson's paradox is mentioned at the beginning of most introductory statistics books. Basically, it says (according to wiki) a trend that appears in several different groups of data might disappear or even reverse when these groups are combined.
- If all the cities in a country have higher GDP per capita after 10 years, does it mean that the country as a whole has higher GDP per capita?
- If a treatment is better (higher success rate) for both group A patients and group B patients, does it mean this treatment is better for group A and B combined?
- If the profit-to-income ratio is higher for every product for company A compared to company B, does it mean company A has higher profit-to-income?
The answer is "not necessarily". And for the same reason, it is meaningless to take an unweighted average for a ratio measurement.
Let me give an example using density. Density is the ratio of the population divided by city area. Let's assume a country with 2 cities: A and B. From period 1 to 2, both cities have more than doubled their density (4 times and 2 times). If we take the direct average of the density of city A and city B, we would wrongly argue that the average density of the nation has more than doubled, while the real density of the nation has decreased by 12%

I made up these numbers, the trick is simply to give the period 1 denser city (B) more weights (Area), and give the period 2 less dense city (A) more weights. I have held the total area to be the same, otherwise, the result could be more dramatic.
A minor issue is that if the areas can be held constant. Then if every city is denser the country will be denser for sure. It would be impossible to reverse the trend, but the error could still be tremendous. In the example below, real density has only increased by 30%, but an unweighted average of period 2 leads to a density 3 times higher than period 1 (130 compared to 35).

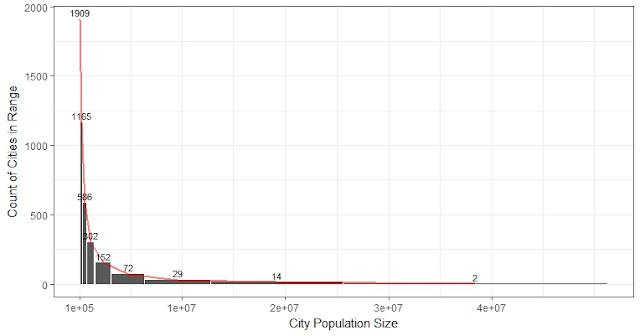
For real urban data, like in Colombia, since all the cities have growing urban extents, an unweighted average would be less biased, but still wrong.


Comments