Posts

Showing posts with the label Air Traffic

Redo Airport Score

Image
This morning I have redone everything mentioned in the  post 1/8 . The last version used an air route dataset of 37,595 records, turned out to be an earlier version. The latest version has 67,240 records. As a quick reminder, "airport score" is a measurement created based on global airport network. It shows how centered each city is in the global air traffic network. In short, the airport score for each point on earth (or each city) is the sum product of airport weights and inverse distances to the point from all the airports. The airport weights are obtained through eigenvector centrality using a dataset of all the airline linkages in the world. Method 1. There are 3,300 airports in total, for each city, calculate the distances  x to each airport, apply an inverse function of the distance f(x) = 1/(1+x)^p to penalize airports that are further away. Different values of the exponent (p) would produce quite different ranking results. I chose p to be 200 through ...
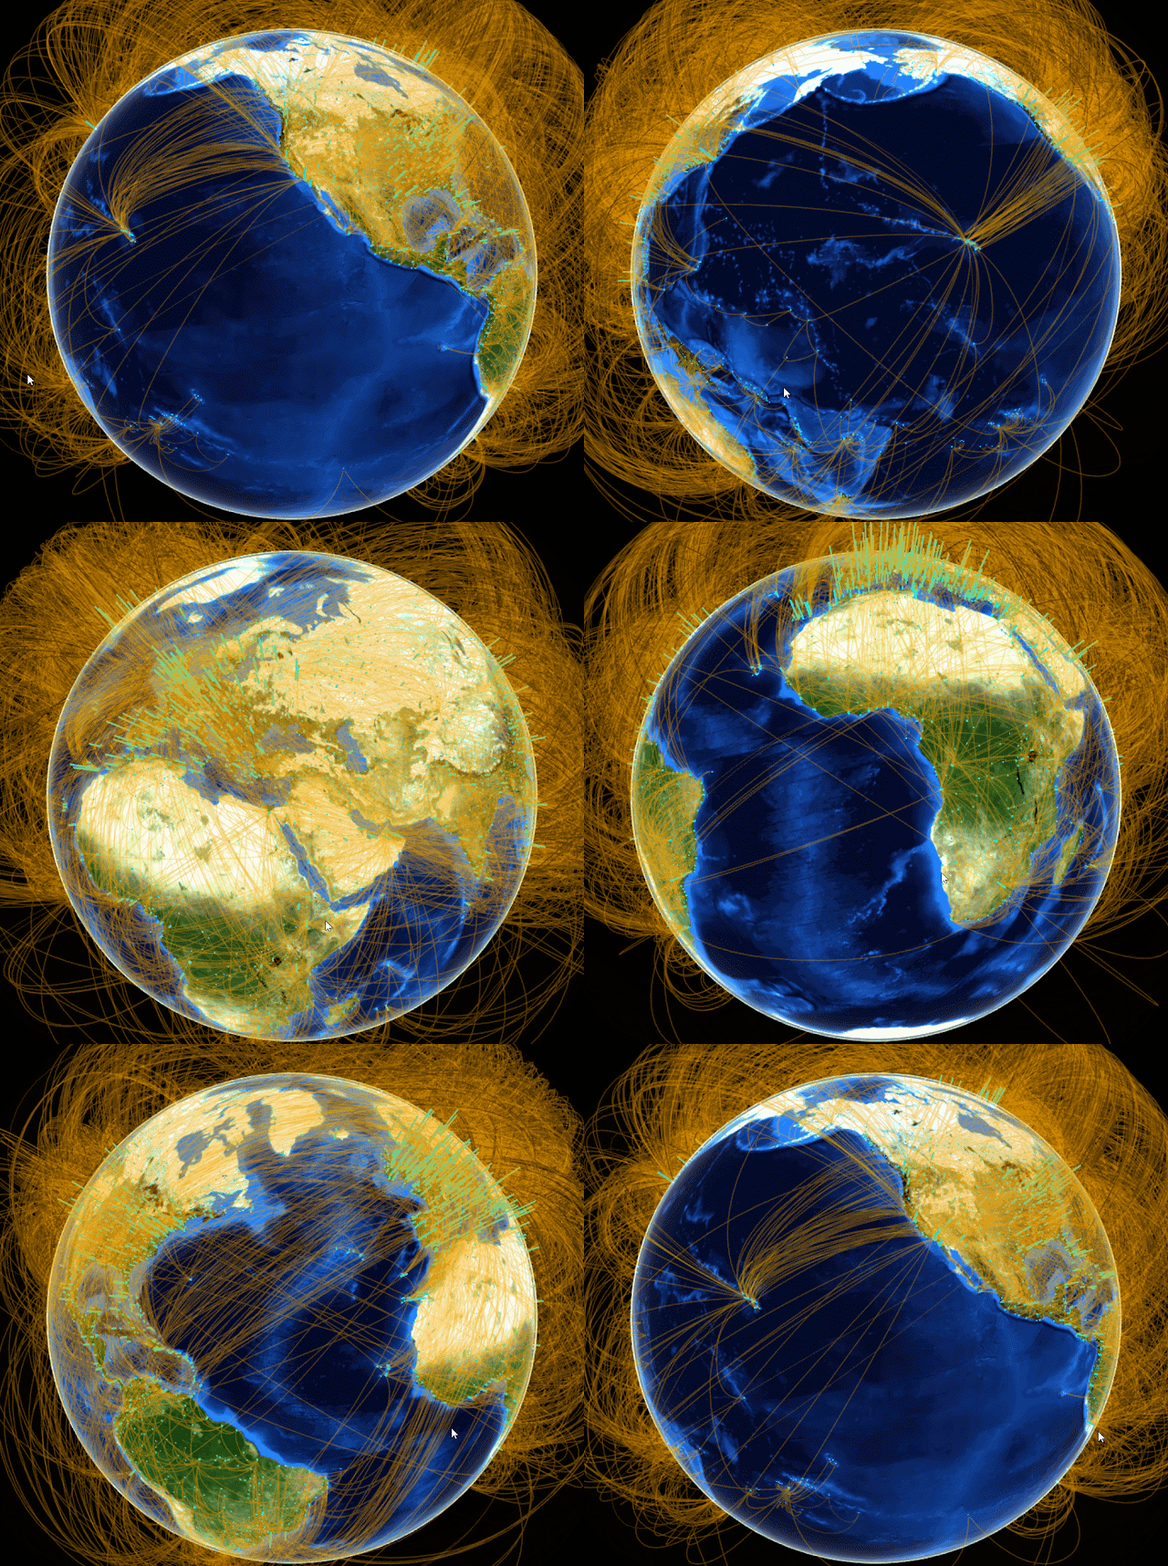
3D World Map: Air Connectivity

Image
(Today all my team members were in office since the boss said he should be back today. He did not show up. But I am glad to see everyone in the new year!) "Airport score" is a measurement created based on global airport network. It shows how centered each city is in the global air traffic network. In short, the airport score for each point on earth (or each city) is the sum product of airport weights and inverse distances to the point from all the airports. The airport weights are obtained through eigenvector centrality using a dataset of all the airline linkages in the world. I have already calculated all the scores but I was thinking over the new year how to visualize them. It turns out not so difficult: I googled "3D world map in R" this morning and found an interesting blog by  Mohit Singh , which I borrowed a lot.  3D world map can be done by the globejs  function  from R package   threejs .  The function can plot both points and arcs in the sa...

A Measurement of Global Connectivity

Image
I have made a video to visualize the variable I created called "airport score". The measurement is created based on global airport network. It shows how centered each city is in the global air traffic network. In short, the airport score for each point on earth (or each city) is the sum product of airport weights and inverse distances to the point from all the airports. The airport weights are obtained through eigenvector centrality using a dataset of all the airline linkages in the world. Method in details 1. There are about 3400 airports in the world, for each point with a longitude and latitude measurement, calculate the distance to each airport: d 2. Apply an inverse function f(x) = 1 / (1 + d)^p , different p gives different result. In the illustration below p = 200 . 2. Time this f(x) with weights w . Then sum over the 3400 airports to get a score. Before the 3D approach, I also tried 2D, which plots the score by horizontal Distance to the center of the city ...