The Weighted Standard Deviation
I have revised the figures in the Conflicts in Colombia paper to add weighted s.e. Together with confidence intervals. Turns out to be not that complicated.


Weighted s.d.:

Add { geom_errorbar(aes(ymin=..., ymax=...), width = 0.2 } in ggplot2 to add the confidence interval into plots:
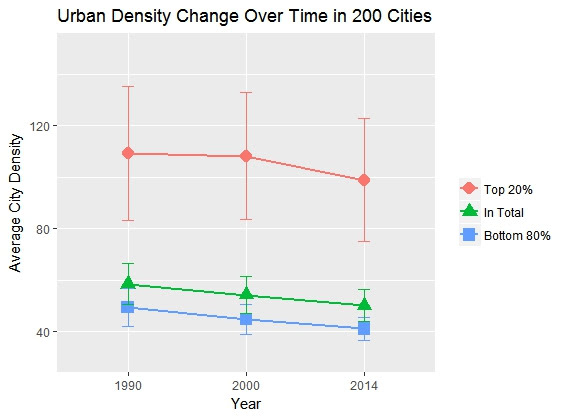
The paper discussed how conflicts in Colombia makes cities develop more sluggish and denser. I will work more on it in the later posts.
The complete R code for the figure
The complete R code for the figure
#   weighted means for global 200 sample
ggplot(data=m4_mean_g_g200, aes(x=year, y=wm, group=Group,
                             color=Group, shape=Group))+
  geom_point(size=4)+
  geom_line(size=1)+
  geom_errorbar(aes(ymin=CI_low, ymax=CI_high), width=.2)+
  ggtitle("Urban Density Change Over Time in 200 Cities") +
  labs(x="Year", y="Average City Density", color = "", shape="") +
  scale_y_continuous(limits = c(30, 150))


Comments