Posts

Catalog of This Blog and Link to My New Blog

Image
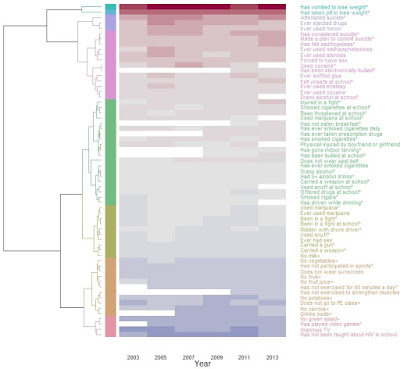
When I realized it is so convenient to write blog directly using R Markdown, I searched if there is a specialized tool for it. And I found  Blogdown , an R package written by Yihui Xie, who is also the author of R Markdown. The new blog is hosted on github: https://liuyanguu.github.io/ Catalog As a summary, I would like to create a catalog for the main topics I wrote so far on this blog. 1. Details behind my work at Marron Institute The Zipf’s Law in details and the math behind How to use our city and population weights How I created the city-level GDP per capita How I calculated the distances for airport score 2. Data Visualization The pattern of 3.5 million commuting trips in Chicago Visualization using heatmap 3D World Map: Air Connectivity (Airport Score) Method and New Updates for Airport Score Visualization of Conflicts in Colombia and the World City population, growth rate, and income 3. Introduction to Statistics Boxplot can be viewed

How to Draw Heatmap with Colorful Dendrogram

Image
Heatmap with Dendrogram: Color Branches and Labels This data visualization example include: * Hierarchical clustering, dendrogram, and heat map based on normalized odds ratios * The dendrogram was built separately to give color to dendrogram’s branches/labels based on clusters using  dendextend * Heatmap is made by  heatmap.2  from  gplots  using the built dendrogram * The rows are sorted by means from highest to lowest, it can be done in either the dendrogram or the  heatmap.2 * Use color palettes from  colorspace Data YRBSS (Youth Risk Behavior Surveillance System) survey data from CDC. This example plots the odds ratios of 63 behavioral questions on one question regarding disordered eating. The odds ratios are median centered by column and log2 transformed Version 1: Color both the branches and labels library (curl) # read file from google drive library (gplots) # heatmap.2 library (dendextend) # make and color dendrogram library (colorspace) #