Poll: Which figure is better? The bars or the points
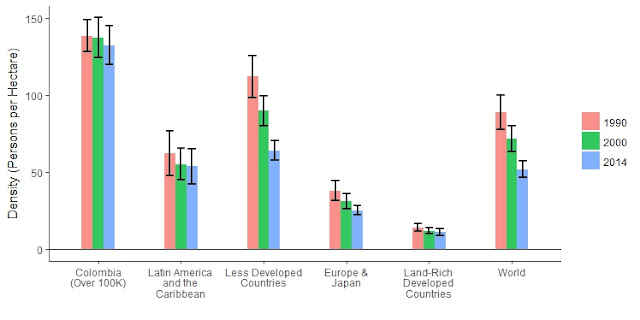
I have two figures that show the same information: means of density by region across three time periods. Figure 1 group by region, use a bar chart. Figure 2 group by year, use scatterplot. Poll: Which Figure is better? Figure 1. Figure 2.