Survey data analysis using SAS
Notes on analyzing survey data using SAS
Work a lot on the survey data this week. It turns out that when using statistical package for survey data, it is critical to include all the three variables: clusters (PSU), strata, and weights. But the difference is smaller if without the cluster and strata information.
*** ***
For example,
These two procedures in SAS (both w/o weights) will produce the same contingency table (frequency count) and thus same odds ratio (since it is calculated from frequency). The confidence intervals around OR are slightly different.
proc freq data = new;
table PCAbove5 * qn26_Sad /relrisk chisq nopercent ;
run;
proc surveyfreq data = new;
table PCAbove5 * qn26_Sad /relrisk chisq nopercent ;
strata stratum;
cluster PSU;
run;
If weights are added to both procedures, we can get the same weighted frequency and OR. The OR is different from the unweighted OR. The confidence interval around OR gets wider.
*** ***
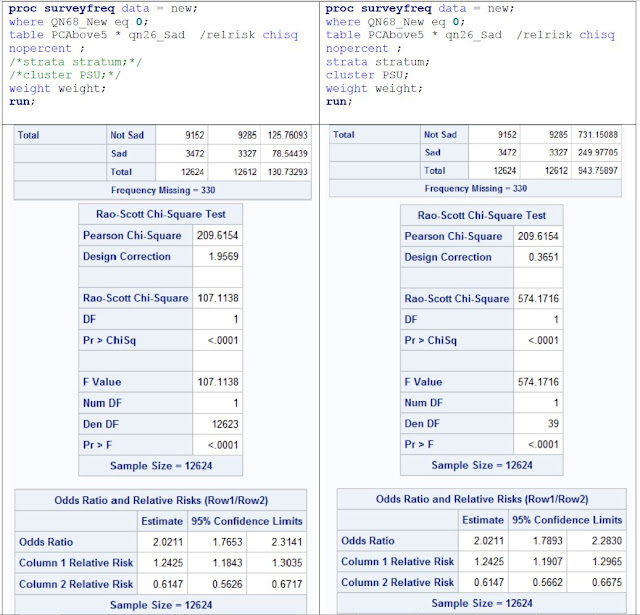
The difference between using strata and cluster and not using is the in design correction, F-value, and confidence interval.
For example:
proc surveyfreq data = new;
table PCAbove5 * qn26_Sad /relrisk chisq nopercent ;
weight weight;
run;
proc surveyfreq data = new;
where QN68_New eq 0;
table PCAbove5 * qn26_Sad /relrisk chisq nopercent ;
strata stratum;
cluster PSU;
weight weight;
run;


Comments