SAS’s Best Subset Selection by Mallows's Cp is actually Stepwise?
SAS’s Best Subset is actually Stepwise?
- I answered this question in my next post:
Best subset selection uses the branch and bound algorithm to speed up
- The original post explaining my own confusion:
- I suspect that the function
regsubsetsfrom R libraryleapsdoes go through all the possible combinations, and it takes hours for 50 variables. - Facing a large number of variables SAS just uses stepwise selection even though the code asks for best subset by adding
selection = cpto the model part ofproc reg. This is my suspicion, I don’t know whether maybe it never scans all the combinations.- I tested with the same dataset from the last post
- Without cross-validation, I used all the 598 observations to run
regsubsets:
# R:
nv_max <- 25 # up-limit of number of variables to test
fit_s <- regsubsets(Share_Temporary~., mydata4,
                    really.big = T, nbest=1, nvmax = nv_max
)
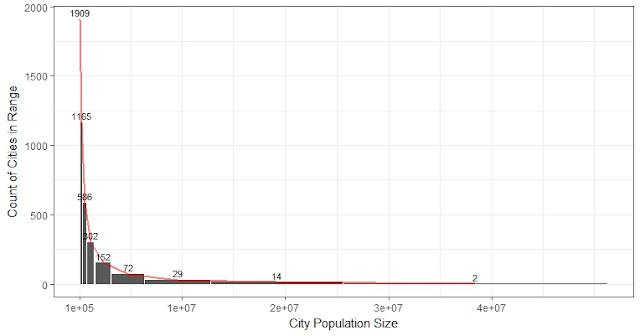
- As we can see from the figure above, the number of variables with lowest Cp is 23, which is surprisingly the same as SAS’s chosen number. But the variables and estimates are all different.
- Some puzzles are:
- The R-sq from
regsubsetsfor 23 variables is different from the R-Sq obtained by running the regression model using the corresponding selected variables. - The adj R-Sqs from model selection process are the same: 0.5683.
- Compare two results (same variables are highlighted):

- This SAS code for Best Subset gives exactly same results as the stepwise selection in R:
- The selected variables are in the right half of the table above.
# SAS code for best subset selection:
proc reg data = mydata4 plot = none;
model Share_Temporary = CC10_Household_Size  -- JJ1_Electricity_Availableyes /selection=cp best =5 vif stb;
run;
quit;

# R code for stepwise selection, which gives same results as the SAS code above:
fit_allvars <- lm(Share_Temporary ~ ., data = mydata4)
step <- stepAIC(fit_allvars, direction = "both")- The stepwise selection in SAS is a modified version of simply stepwise based on some conditions. As shown in the SAS results:
- All variables left in the model are significant at the 0.1500 level.
- No other variable met the 0.1500 significance level for entry into the model.
/* SAS code for best subset selection*/
proc reg data = mydata plot = none;
model Share_Temporary = CC10_Household_Size  -- JJ1_Electricity_Availableyes /selection=cp best = 3 stb;
run;
quit;

/* SAS code for stepwise selection*/
proc reg data = mydata plot = none;
model Share_Temporary = CC10_Household_Size  -- JJ1_Electricity_Availableyes /selection=stepwise;
run;
quit;
A comparison of SAS results: same variables are highlighted. All the variables that are in stepwise selection result are included in the "Best Subset" selection result.

A second-round selection
Here is the interesting part that occurred to me this morning. What would happen if I run a second round feature selection on the variables selected above?
- Re-run selection on the selected 23 variables.
- If the 23 variables were chosen by R stepwise (or SAS Best Subset), SAS will choose 21 from it. The result of SAS Best Subset equals SAS stepwise. R won’t make any change, both methods in R still just keep all the 23 variables.
- If the 23 variables were chosen by R Best Subset, all the methods (both best subset and stepwise in R and SAS) will choose the same 18 variables in the second round. This might be a more rigorous way, but it would take much more time during the first step to run best subset selection in R.
- If we only care of explanation then we only need to find out the key predictors. Stepwise should be enough. The most influential players will be in the model anyway.
Comments
sas online course